
Last updated: 19/01/2026.
User Help Guides
Dynamic Financial Reporting

Summary
Dynamic Financial Reporting is an addon created by Eureka Business Solutions that allows financial data to be displayed and exported in different layouts and formats, it also allows for comparison between data and drill down into the underlying data.
Prerequisites
It is important to note that the Dynamic Financial Reporting addon does not work unless there are standard Sage financial layouts present on your system. If you do not have any set up, a guide on doing so can be found here.
The Program
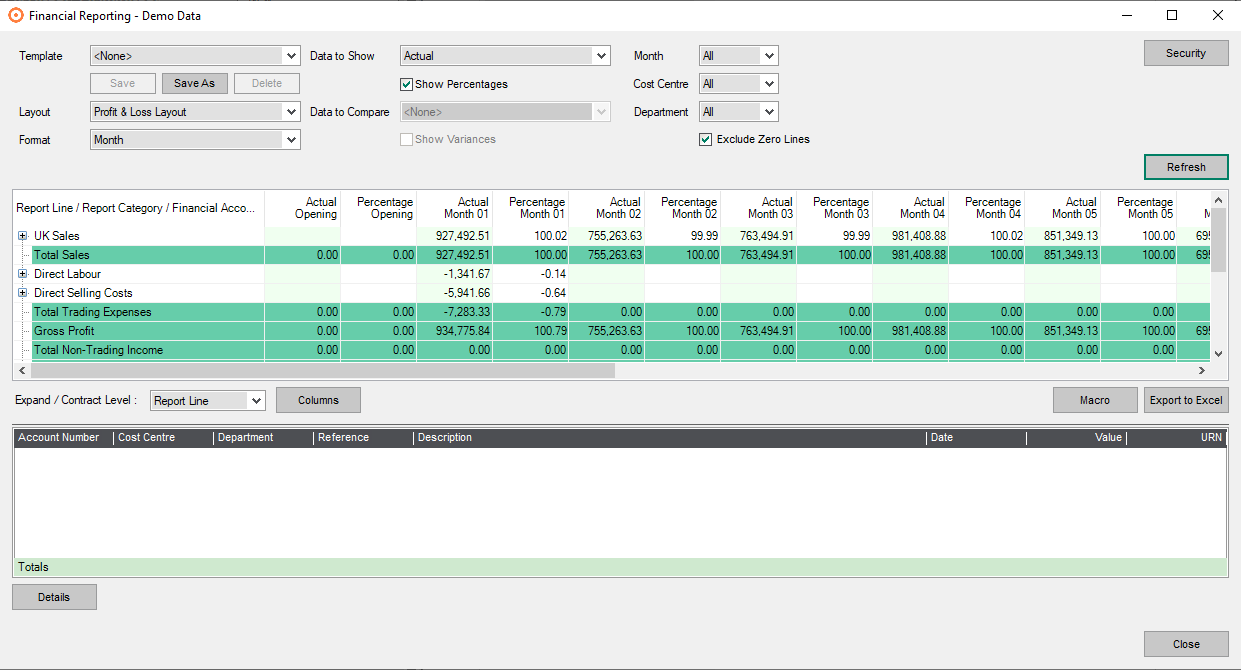
When opening the Dynamic Financial Reporting addon a new window will open displaying several dropdown menus which will look like this:
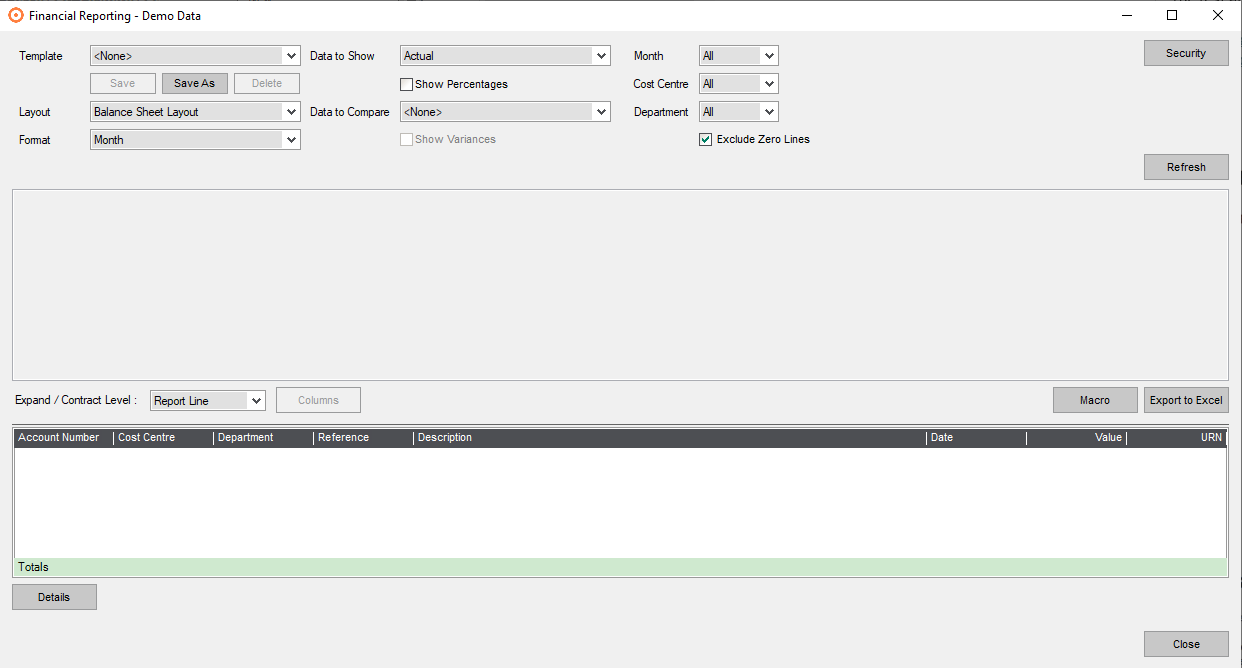
Selecting Data
The data shown in the report will be decided by the ‘Layout’ option which uses the financial layouts available in Sage to determine which report codes and account categories are included and how they will be displayed. All financial layouts are available here such as the profit & loss, balance sheet or cash flow layouts.
This data is also influenced by the ‘Data to Show’ option which by default shows the ‘Actual’ financial data for the year but can be changed to show the data for the ‘Next Year’ using the deferred postings in Sage (if there are no periods in the current year marked as ‘Future’) or the budget data for the five years Sage keeps
The data can be further altered using the ‘Format’ option which gives the option to show the data monthly, quarterly, by cost centre or department.
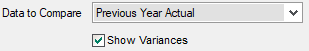
The ‘Data to Compare’ option can be used to show the ‘Previous Year Actual’ or the budget data for the current year or five future years in additional columns. The difference between these data sets can be added as an additional column using the ‘Show Variances’ option which can only be selected when the ‘Data to Compare’ option is in use.
The ‘Show Percentages’ option can be selected to add additional columns showing the percentage of profit for the month/cost centre/department, each line can be drilled down into to see how much it contributes to the relevant total on both overheads and sales, both of which are then summed together to give the percentage profit. The ‘Show Percentages’ option can only be used when not using the ‘Data to Compare’ option.
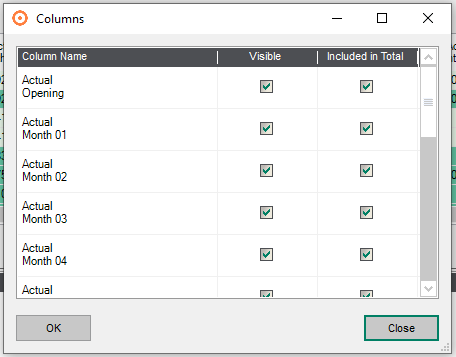
The ‘Columns’ button can be used to hide each column or exclude it from the report total. If hide is selected, the column won’t be visible but the data within it will be included in the totals and if exclude is selected then the column will still be visible but the data within won’t be included in the totals. Both options can be selected simultaneously so the data won’t be visible, nor will it be included in the totals.
Filters
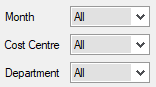
The ‘Month’, ‘Cost Centre’ and ‘Department’ options are by default set to ‘All’ which will show the data for all cost centres, departments and months. The month option has two other options, “Is” which will filter the data for a specific month, and “Between” which filters the data between whatever two dates are entered. When selecting either of these options additional dropdown menus will appear where you can select which month to filter for or which months to filter between. The cost centre and department options have the ‘Is’ and ‘Between’ options too but also an additional one called ‘In’ which allows the selection of multiple cost centres that aren’t necessarily in order compared to the ‘Between’ option which includes everything between the selected values.
If there are lots of lines with no value in the data, the ‘Exclude Zero Lines’ option can be selected to stop these lines from showing.
Utilisation
Once all the settings are as desired the ‘Refresh’ button will display the data in the space beneath. Within the data there are plus symbols at the start of each line which expand the data on that line to show the report category data which can be expanded again to show the nominal accounts. This can be done on the individual lines or overall using the ‘Expand / Contract Level’ option. For even more detailed information any light green cell can be selected on the report, and it will give a detailed drill down of all the transactions that contribute to that data subject to historical filing settings.
These transactions can then be selected from the list and viewed using the ‘Details’ button which opens another window showing all the details for that transaction.
The ‘Macro’ option allows an Excel macro to be added to the data for when it is exported which will then perform a task or series of tasks with the data. If a macro is entered and the settings are then saved as a template, the macro will also be saved as a part of this. This is not included in standard support but if you are interested in having some macros created contact us at support@eureka-bsl.co.uk and we can provide more details.
The ’Export to Excel’ option does precisely what it says, however there are a few things to note about it. When clicked the data in the top list will be exported in the same way it is being viewed so any lines that have been expanded and any columns that have been hidden will not be included in the export. The data in the bottom list can also be exported by right clicking within the list and selecting ‘Export’.
Templates
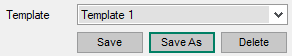
All the options detailed above will filter the financial data to suit your needs allowing you to save these settings as templates to be easily accessed in the future. These saved templates can be named and altered as required using the template options in the top left’.
Security
The security option in the top right will open the security window allowing changes to ‘User Security’ and ‘Global security’.
User Security
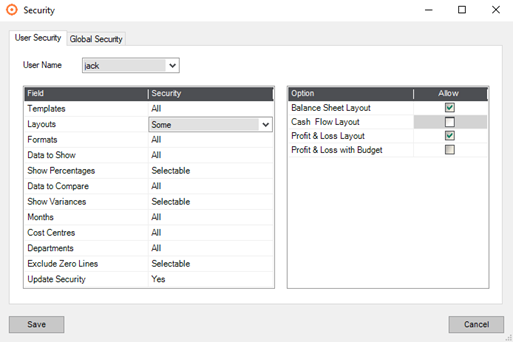
‘User Security’ is used to change what each user can access for the financial reports, by default users can access everything. Each of the options shown above has the option to allow the selected user, in this instance ‘jack’, access to ‘All’ the options for that field or ‘Some’ of them. When ‘Some’ is selected more options appear on the right side of the window, by default all these options are enabled but can be disabled individually so the selected user cannot access them. There are a few lines below that are shown as ‘Selectable’ these correspond to the tick box options e.g. show variances and exclude zero lines. These options can be changed to ‘Always Unticked’ in which case the boxes show greyed out for the selected user.
Global Security
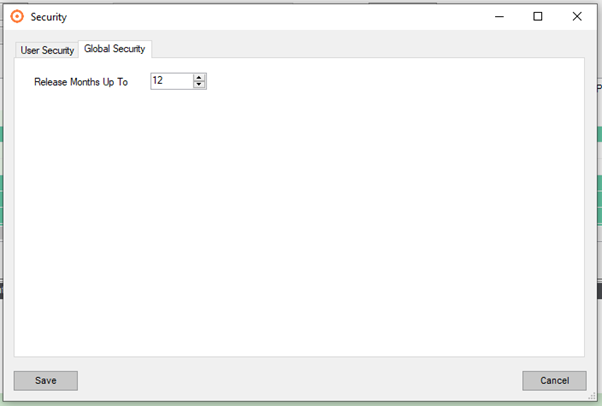
The ‘Global Security’ option can be used to release data for periods in the financial year from 1 up to 12.
Stand Alone Usage
Dynamic financial reporting can be added as a desktop executable for users who need to see the financial data but don’t need full access to Sage, additionally this program will not use a Sage licence when it is being run, however, the user will still need to be set up as a Sage 200 user and they will also need the Sage 200 client installed for the user on their machine. Additional licensing costs apply for this option to be enabled